Energy Diagrams
Core Concept
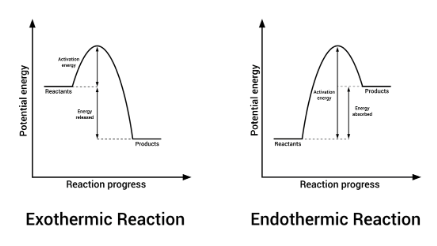
Energy diagrams represent the energy changes that occur during a chemical reaction. They help us visualize the difference in energy between reactants and products, the activation energy required for the reaction, and whether a reaction is exothermic or endothermic.
Key Tips
The energy levels at the start and end of the diagram represent reactants and products, indicating if the reaction is exothermic or endothermic.
The transition state at the curve's peak is the highest energy, unstable intermediate where bonds are partially broken and formed.
Exothermic reactions release energy with products lower in energy than reactants, while endothermic reactions absorb energy with higher-energy products.
Catalysts lower the activation energy by providing an alternative pathway, reducing the peak's height in the diagram.
The x-axis shows the reaction progress, and the y-axis represents potential energy throughout the reaction.
Higher activation energy correlates with slower reaction rates, as fewer molecules have enough energy to overcome the barrier.
Test Yourself
Podcast Episode
Practice Problems & Worked Out Examples 🔒
Browse by category
Identification and Labeling of Diagram Components
→ 02Qualitative Thermodynamic Classification (Exo vs. Endo)
→ 03Quantitative Energy Calculations
→ 04Sketching Diagrams from Thermodynamic and Kinetic Data
→ 05Catalyst Analysis and Effects
→ 06Multi-Step Mechanisms and Intermediates
→ 07Other / Uncategorized
→ 07Assorted Multiple Choice
→
| Feature | Exothermic Reactions | Endothermic Reactions |
|---|---|---|
| Energy Flow | Energy is released during the reaction. | Energy is absorbed during the reaction. |
| Enthalpy Change ($\Delta H$) | $\Delta H$ is negative. Products have lower energy than reactants. | $\Delta H$ is positive. Products have higher energy than reactants. |
| Diagram Shape | Starts at a higher energy level (reactants), rises to the transition state, and drops to a lower energy level (products). | Starts at a lower energy level (reactants), rises to the transition state, and ends at a higher energy level (products). |
| Examples | Combustion, Neutralization. | Photosynthesis (absorbing sunlight), Thermal decomposition. |
Key Components of an Energy Diagram
Reactants:
Represent the starting substances in a reaction.
Located on the left side of the energy diagram.
Products:
Represent the substances formed in a reaction.
Located on the right side of the energy diagram.
Activation Energy ($E_a$):
The minimum energy required for the reactants to transform into products.
Represented as the energy "hump" between the reactants and the peak of the diagram.
This energy is needed to break existing bonds and start the reaction.
Transition State:
The highest-energy point on the energy diagram, located at the peak of the activation energy hump.
Represents an unstable arrangement of atoms where bonds are partially broken and new bonds are partially formed.
Enthalpy Change (ΔH):
The difference in energy between the products and reactants.
ΔH < 0 : Indicates an exothermic reaction (energy is released).
ΔH > 0 : Indicates an endothermic reaction (energy is absorbed).
Topic Related Resources
Lab
Coming Soon...
Lab
Coming Soon...
Demo
Coming Soon...
Demo
Coming Soon...
Activity
Coming soon...
Activity
Coming soon...
Simulation
Coming soon...
Simulation
Coming soon...