Unit 2: Compound Structure and Properties
Episode · Intermolecular Force & Potential Energy

Essential Knowledge
◼ A graph of potential energy versus the distance between atoms is a useful representation for describing the interactions between atoms. Such graphs illustrate both the equilibrium bond length (the separation between atoms at which the potential energy is lowest) and the bond energy (the energy required to separate the atoms) (SAP-3.B.1) Go to Section
◼ In a covalent bond, the bond length is influenced by both the size of the atom’s core and the bond order (i.e., single, double, triple). Bonds with a higher order are shorter and have larger bond energies. (SAP-3.B.2 ) Go to Section
◼ Coulomb’s law can be used to understand the strength of interactions between cations and anions.
a. Because the interaction strength is proportional to the charge on each ion, larger charges lead to stronger interactions.
b. Because the interaction strength increases as the distance between the centers of the ions (nuclei) decreases, smaller ions lead to stronger interactions (SAP-3.B.3 ) Go to Section
Learning by Problem Solving
◼ A graph of potential energy versus the distance between atoms is a useful representation for describing the interactions between atoms. Such graphs illustrate both the equilibrium bond length (the separation between atoms at which the potential energy is lowest) and the bond energy (the energy required to separate the atoms) (SAP-3.B.1)
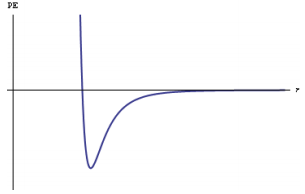
The bond energy for a C=C bond is 614 kJ/mol with a bond length of 1.34 Å. It is shown on the graph below. Sketch a C-C bond and a C=C bond on the graph. Include a key.
Identify the key features of the graph:
The x-axis represents the internuclear distance (bond length) in Ångstroms (Å).
The y-axis represents the potential energy (PE) in kilojoules per mole (kJ/mol).
The graph shows the potential energy curve for a C=C bond, which has a minimum potential energy at a bond length of 1.34 Å and a bond energy of 614 kJ/mol.
Sketch the C-C bond:
The C-C bond is a single bond, which is weaker than a C=C bond. Therefore, the potential energy curve for a C-C bond will be lower than the curve for a C=C bond.
The C-C bond length will be longer than the C=C bond length.
To sketch the C-C bond, draw a curve that is lower and to the right of the C=C bond curve. The minimum point of the curve will be at a bond length longer than 1.34 Å and a potential energy lower than 614 kJ/mol.
Sketch the C=C bond:
The C=C bond is a double bond, which is stronger than a C-C bond. Therefore, the potential energy curve for a C=C bond will be higher than the curve for a C-C bond.
The C=C bond length will be shorter than the C-C bond length.
To sketch the C=C bond, draw the curve that is already shown on the graph. This curve represents the potential energy curve for a C=C bond with a bond length of 1.34 Å and a bond energy of 614 kJ/mol.
Include a key:
Add a key to the graph to label the two curves. For example, you could label the C-C bond curve as "C-C" and the C=C bond curve as "C=C."
Here is an example of how the graph could look with the C-C and C=C bonds sketched and labeled:
<insert>
Remember: The exact positions of the C-C and C=C bond curves will vary depending on the relative strengths and bond lengths of the two bonds. The important thing is to show that the C-C bond has a lower potential energy and a longer bond length than the C=C bond.
Try it yourself …
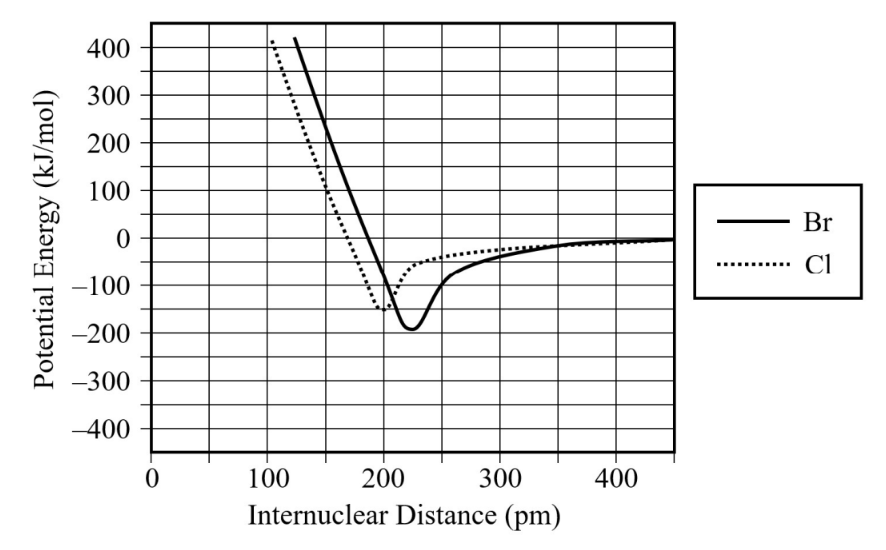
The diagram above shows the relationship between potential energy and internuclear distance.
The curve for two bromine (Br) atoms is indicated by a solid line.
(a) Use the information in the diagram to estimate the following values.
Bond length of the Br–Br bond: ___ pm
Bond energy for the Br–Br bond: ___ kJ/mol
(b) Do you predict that the bond length of the Cl–Cl bond should be shorter or longer than that of the Br–Br bond? Justify your answer in terms of periodic trends.
(c) A student sketched the potential energy curve for two Cl atoms on the diagram above, as indicated by the dotted line. There is an error with the student’s sketch. Identify this error, and explain how the potential energy curve should be corrected so that it would be a more accurate representation of the bond between two Cl atoms.
◼ In a covalent bond, the bond length is influenced by both the size of the atom’s core and the bond order (i.e., single, double, triple). Bonds with a higher order are shorter and have larger bond energies. (SAP-3.B.2 )
Nitrogen and oxygen form diatomic elements. Nitrogen has a triple bond, while oxygen has a double bond. Identify each on the graph below:
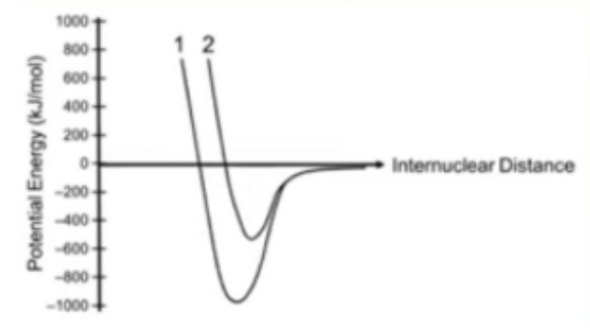
Nitrogen would correlate with Curve 1; Oxygen would be Curve 2.
Since nitrogen has a triple bond (compared to oxygen’s double bond), it would expect to have greater bond energy (more exothermic). The point on the graph where potential energy is minimized (dip on the curve) is considered the bond energy.
Try it yourself …
When comparing bonds between the same atom, we can make the following general statements.
A double bond is ( shorter OR longer ) and ( weaker OR stronger ) than a single bond.
A triple bond is ( shorter OR longer ) and ( weaker OR stronger ) than a double bond.
As the bond order increases, the bond length _____ and the bond energy ____ .
Check your answer here.
◼ Coulomb’s law can be used to understand the strength of interactions between cations and anions.
a. Because the interaction strength is proportional to the charge on each ion, larger charges lead to stronger interactions.
b. Because the interaction strength increases as the distance between the centers of the ions (nuclei) decreases, smaller ions lead to stronger interactions (SAP-3.B.3 )
Choose the compound from each pair that would have the greatest (most exothermic) lattice energy and explain. (a) MgO or NaCl; (b) MgO or BaO
The greater the charge, the higher the lattice energy.
The smaller the size of the ion, the higher the lattice energy.
MgO; Mg is 2+ and O is 2- (compared to Na +1 and Cl -1); the greater the charge, the greater the attraction.
MgO; Charges are equivalent in comparison, therefore the size of the ions will ultimately influence lattice energy. Mg2+ is smaller than Ba2+ therefore the magnesium ion will be able to be closer to the oxide ion; therefore having greater attraction to it.
Try it yourself …
| Substance | Lattice Energy (kJ/mol) |
|---|---|
| sodium fluoride, NaF | 930 |
The lattice energy of sodium fluoride, NaF, is given in the table above.
(a) Do you predict that the lattice energy of sodium chloride (NaCl) should be less than or greater than 930 kJ/mol? Justify your choice in terms of periodic trends and Coulomb’s law.
(b) Do you predict that the lattice energy of magnesium oxide (MgO) should be less than or greater than 930 kJ/mol? Justify your choice in terms of periodic trends and Coulomb’s law.
Intramolecular Force and Potential Energy Practice
...
Syncing quiz data...